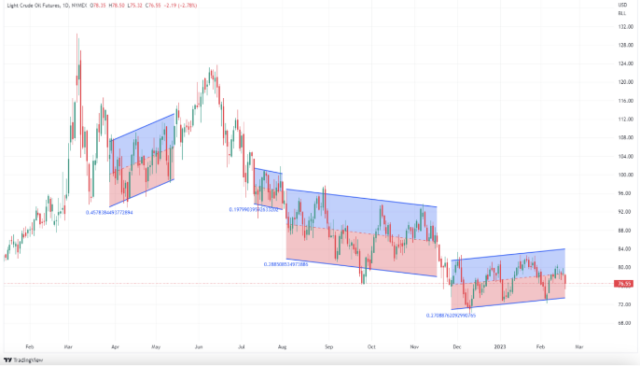
In any market, it often happens that bulls or bears grappling in a battle do not allow the price to go up or down. You can hear or read on thematic forums or chats that a balance is formed, it is also a flat. In plain words, a state of the market when the price moves in a relatively limited and conditionally horizontal corridor between two levels, where resistance is above and support is below.

Nevertheless, sooner or later there is a breakdown, and the price begins its directional movement in one of the directions. Such moments can always be explained from a technical point of view, when one of the sides begins to dominate, withdrawing its volumes, gaining an advantage due to new transactions and the absorption of stops and opposite smaller transactions. Accordingly, demand begins to exceed supply or vice versa, and the price, as a natural phenomenon in the market, begins to change in order to satisfy the needs of all participants in the economy.
So the fundamental side of the issue takes place in this situation. In almost every case, the exit from the so-called balance zone often has a weighty informational reason, whether it is an unemployment report, or a fire in another part of the world. News and economic events become the catalyst, and the actions of the traders themselves act as fuel.
Therefore, it is always important to understand where, when and what event will occur and take this into account when analyzing and planning trades. Yes, it is not always possible to accurately predict the price movement at the time of the news release, but be prepared for the fact that volatility will increase sharply, spreads will widen, etc. Having prepared for this, correctly controlling open positions by adding or moving stops, or closing trades altogether and waiting for the market to start moving and re-entering at that moment, is much better than losing your entire deposit in one moment – simply because you forgot that news is coming that affects both one sector and the general state of the world.
One of the tools that experienced traders and analysts of large companies always use is the economic calendar. It is not necessary to remember exactly at what point of the month the news will be, it is enough to glance at the upcoming (or even past) events at the beginning of your trading session and be ready for anything.
Of course, not all news carries an important event that can significantly affect prices and affect the overall state of the market. Therefore, it is useful for each market participant to set up a calendar for themselves and follow what will be useful to them. By limiting the countries and the priority of events, you can greatly facilitate your analysis and get rid of unnecessary ‘information noise’.
So what’s so influential about the news? Let’s look at the example of Bitcoin.
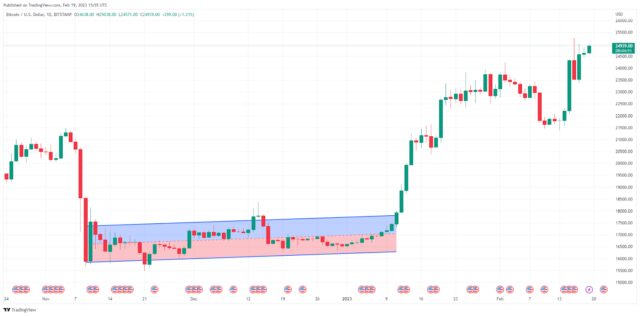
After November 2022, the price of the well-known coin had been in the range of $16,000 to $17,500 per coin, with rare exits for support and resistance, and returns back to the supply and demand balance zone, false breakouts, as it is commonly called.
But on January 12, 2025, at 13:30 UTC, even before the release of inflation data from The Bureau of Labor Statistics (BLS), amid expectations of a decrease in the level, growth began, which only accelerated after the release of the main news. Thanks to the fact that analyst expectations turned out to be correct, Bitcoin was able to hold above the important level at $18 000 and continue its directed upward movement, where (from a technical point of view) large buyers distributed the volume accumulated during the sideways movement and received their profits.

The rest of the cryptocurrency market, as expected, began to follow the lead of its flagship, and it would seem that the news related to the state of inflation in the United States affected all other instruments.
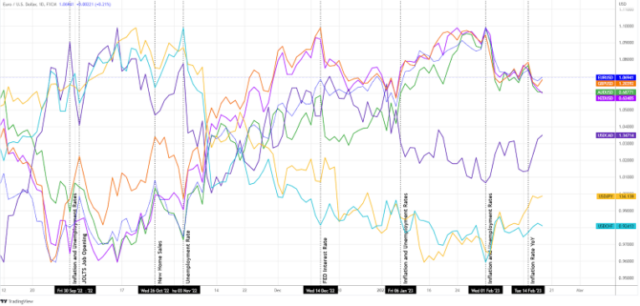
Although usually, it is the traditional currency market that is most affected by economic events, which are often displayed on the calendar as the most important. They should always be given maximum attention.

In the general chart above, you can clearly see how different reports influenced currency pairs. Some are stronger, others are not, but the general trend persists and a certain pattern can be traced over the past half a year, when inflation and unemployment data significantly impact the market and make prices move mainly in a direction.
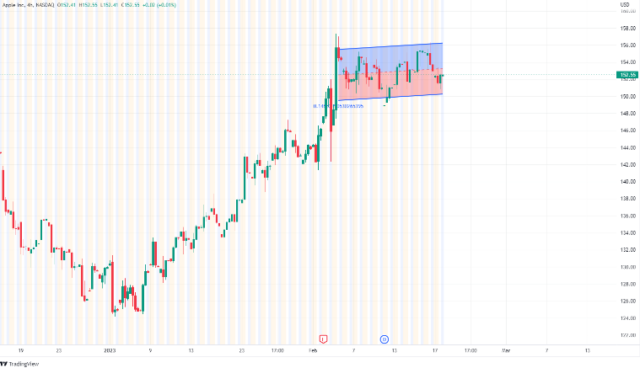
Another good example is AAPL, where right now you can see a situation where buyers and sellers form a balance in the range from $150 to $155 per share and there are no prerequisites for where the price will go in the near future.
All that remains is to open the economic calendar for the next week, highlight not only general important events, but also understand what can have an impact on the market as a whole. And based on these conclusions, have an idea of when the price can leave the corridor or continue to stay in it.

Thus, any economic event reflected in the calendar can provide the basis for factors affecting the price situation.
This is the butterfly effect in action – the knowledge of which the eagle-eyed trader can use to their advantage.


