When you want to present your data to a wider audience or simply dive into it, flowcharts are there to help. So, you will use symbols and short text labels to display input, output, storage locations and paths. It’s actually the perfect way to summarize all the important information within a graphic presentation.
Some information simply cannot be expressed in words alone. Best of all, you don’t have to be a technical person to manage flowcharts. Just read more about them below.
Types
Flowcharts are the most popular choice for business process review. However, there are different types to help you identify potential problems in different areas of business processes. You will also clarify all operations that involve complex tasks. Before moving on to complex tasks, it is important to start with a basic analysis of the workflow. This will identify any weaknesses.
Process Flowcharts

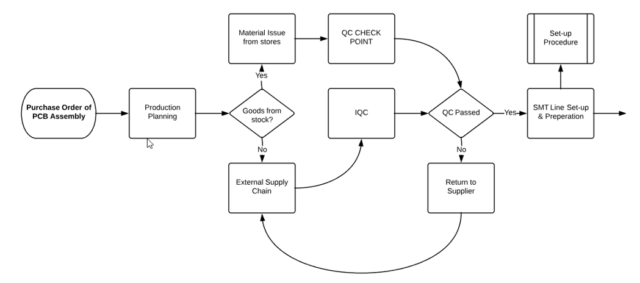
These flowcharts are also called communication flowchart. It is probably the most versatile type, because it applies to everyone. It will actually help you to explain the situation in your organization very quickly. You will usually use it when you want to quickly explain a problem that has occurred. However, you will also use it to draw roles and responsibilities within the organization, as well as to describe production processes or transfer information. Thus, they are used mainly for the purpose of production, administrative or service processes. They can also be very useful for high-level processes.
The Workflow chart
If you want to train new employees, identify problem areas or create your own team, then this is your type of diagram. It will help you stay informed about the processes within the business. This applies to all data and documents in the organization, as well as other details.
Factorial flowchart

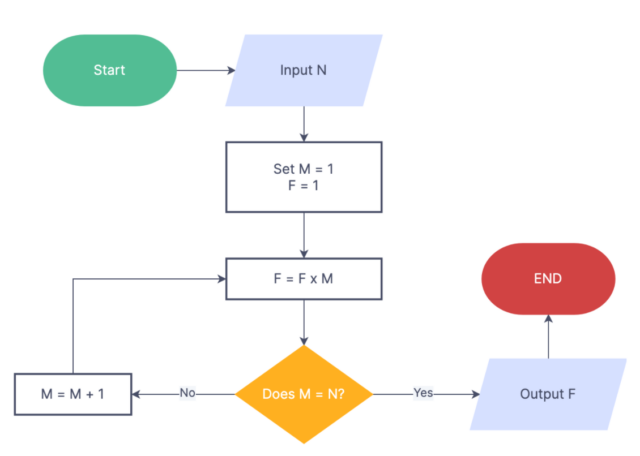
Factorial flowchart is very complex, yet very useful type of flowchart. Used to calculate N factorial. In mathematical operations, the N factorial is denoted as N! so as in flowcharts. Factorial is actually umber multiplied by each number in order. Numbers must be descending. Factorial flowchart allows the process to be calculated very easily and quickly. To see how this flowchart looks like, check out https://www.zenflowchart.com/guides/factorial-flowchart
Swim Lane Diagrams
In the world of diagrams, this is a step further because it shows not only the processes but also each unit within the organization. Thanks to that, you will have high flow control and insight into different departments. It is a great quality management tool because it tells you who is responsible for different tasks. You will be more successful at every stage of the process, because it is better than the typical workflow chart.
Visualization

One of the biggest benefits of using flowcharts is the ability to visualize multiple advances. You will also get a better insight into the workflow. It is an opportunity to discover which step is unnecessary and where you need improvement. So, diagrams create visual representations of the process, which is why they are a very popular choice for programmers and everyone else who makes important decisions and solves problems on a daily basis.
Thanks to the software, you don’t have to create diagrams manually, because that would take a lot of time. Drawing by hand also requires considerable effort, but with software it’s getting easier. Various templates, shapes, and connectors are available to users, allowing them to quickly compile complex diagrams. Once created, they are very easy to share and revise.
Improved communication
Due to the simplicity of creating and sharing, teams work much better together when creating, editing and analyzing flowcharts. The software contains a lot of tools for sharing files and screens, as well as many apps and functions. This gives users more space to comment and take notes.
It is an opportunity to communicate with each other without changing the screen. Improved communication is not the only advantage when it comes to employee relations. Flowcharts also improve the workflow itself, as all processes are better updated and refined. Everyone will follow the work much better when it is in a visual format.
The concept of organization

When you are equipped with diagrams, it is much easier to show the complexity of the system. Such documents provide people with much more details about the various processes and structures of the company. What is great about them is the clarity of the concept, which is otherwise harder to understand. Instead of spending a lot of time reading and deciphering documents or work instructions, you now achieve the same job with diagrams.
Thanks to that, everyone can go through complicated and interconnected systems. You no longer need a mountain of paperwork to set up an organization chart. In this case, the elements of the diagram make the analysis much easier. For example, a certain symbol indicates the beginning or end of a process, another represents an action, and so on.
Solving problems within the business
Problem solving is an integral part of any business. That is why you need effective techniques and tools for that purpose. Diagrams are very useful, because you will use them to gain a comprehensive insight into a particular problem.
Cooperation among employees has been facilitated because they now have a better approach to problem analysis. It is an opportunity to come up with a solution. While you think, the software works for you. He will explain all the problems and define them in parts. Then, you will have all the available information related to the key issue.
Document management

People approach learning differently, but most of them learn better through visualization than by reading. That is why diagrams are a very useful thing. They will simplify all difficult procedures, and that is great news for human resources departments. Thanks to the diagrams, they can more easily include new workers.
However, they are equally useful for all employees because it is much easier to work with documentation in the form of flow charts. You can also help your customers make better use of the things they bought, because you will provide them with instructions in the form of diagrams. They will be more satisfied with your business.
Conclusion:
While creating flowcharts, don’t forget a few key points in the whole process. Always pay attention to the structure, because your diagrams must be legible. So, the most important thing is that the end user gets all the necessary information. However, if the layout of the elements is not good, that will not happen. It is also important to stay consistent when using shapes, fonts, colors and everything else. It is advisable to use contrast, because you do not want the same color or set of colors for each shape. Finally, test the design.


